Six weeks into the school year, my fourth graders took their first benchmark assessment. These came every six weeks or so, right up to the end-of-year test. It was how the district tracked our progress. None of my students passed the reading assessment. The world’s best teacher could not have caught my students up in six weeks, let alone a first-year teacher like me.
Unfortunately for me, I did not have a reputation to fall back on. No one could point to previous classes I had taught to show that I was capable of getting the students where they needed to be by the end of the year.
So, I was put on a Performance Improvement Plan and told I needed to get students to pass the next assessment in six weeks. Over the weekend, I regrouped because I did not want to get fired from my first job and because my students deserved my very best. What I was doing wasn’t working, and it was my job to fix it. No more Reader’s Workshop. I used the assessment results to build a plan to support students in specific skills. I made center activities for students to do together while I worked with a small group of students on specific skills.
On Monday, I rolled out my new plan: Targeted Small Group Instruction. I remember feeling nervous that my classroom would lose the joy we had created. But that’s not what happened. We were still reading books and sharing what we learned, but it was focused on what I knew my students needed to learn. On the next assessment, a third of my class passed. By the end of the year, most of the class was reading on grade level.
Looking back, I know I needed that PIP. It forced me to rethink everything about how I taught reading. I listened to my mentor teachers when they told me to move to small groups, and I've never stopped being grateful for that. Because of their generosity, my students learned to read.
I also wish I hadn't been the one on the hook for test scores twelve other teachers had a hand in. But someone has to teach the kids how to read.
Year after year, states’ own tests show that a large share of students are not reading on grade level.
Every year, states report on the reading proficiency of students in third through eighth grade. Each state gives its own reading test, sets its own bar for proficiency, and publishes how many students passed. Most states only report reading proficiency for third grade and above. Many screen younger students under state literacy laws, but K–2 results generally aren't published at the state level.
Federal law has required end-of-year reading assessments for third through eighth grade students since the mid-2000s with the No Child Left Behind Act. In 2015, the Every Student Succeeds Act kept the reading assessment requirement but provided states with more flexibility to develop their own assessments, define reading proficiency, and decide how schools get rated.¹
How do states measure reading proficiency?
About 40 states use a four-level scale to report on reading proficiency, where Level 3 is the grade-level mark.² They might call it “Meets Grade Level,” “Proficient,” or “On Track.” What would you assume that means? That your child has this year's skills down and is ready for what comes next. Some states add a caveat.Texas calls its grade-level tier "Meets Grade Level," and says those students "have a high likelihood of success in the next grade or course but may still need some short-term, targeted academic intervention."³ Florida's Level 3 is labeled "On Grade Level," and Florida's own guide for families adds that these students "may need additional support for the next grade/course."⁴ So when you see that label, it means your child has met a minimum requirement set by the state. It does not mean they are reading well.
A few states stand out enough to mention by name.
- Florida uses a five-level scale. Level 3 is On Grade Level with the caveat above. Level 4 is Proficient and Level 5 is Exemplary. When Florida reports reading proficiency, it counts Level 3 and above.⁴
- Ohio uses a five-level scale. Proficient is the third level, followed by Accomplished and Advanced. When Ohio reports reading proficiency, it counts Proficient and above.²
- Mississippi also uses five levels. Level 3 is labeled Passing; Level 4 is Proficient. When reporting on reading proficiency at the state level, Mississippi only counts students who scored Level 4 and above, leaving its own grade-level tier out of the number it publishes.⁵
- North Carolina uses four levels like most states, but counts three of them as on grade level instead of two. Its bar sits one tier lower than the national norm.⁶
- Iowa and Nebraska use a three-level scale. Iowa’s middle level is called Proficient, and Nebraska’s is called On Track. For both states, Level 3 is Advanced. (Iowa moved to a four-level scale beginning with the spring 2026 test.)⁷
What can the assessments tell us?
Here’s where every state landed for the 2024-25 school year, averaged across grades 3 through 8.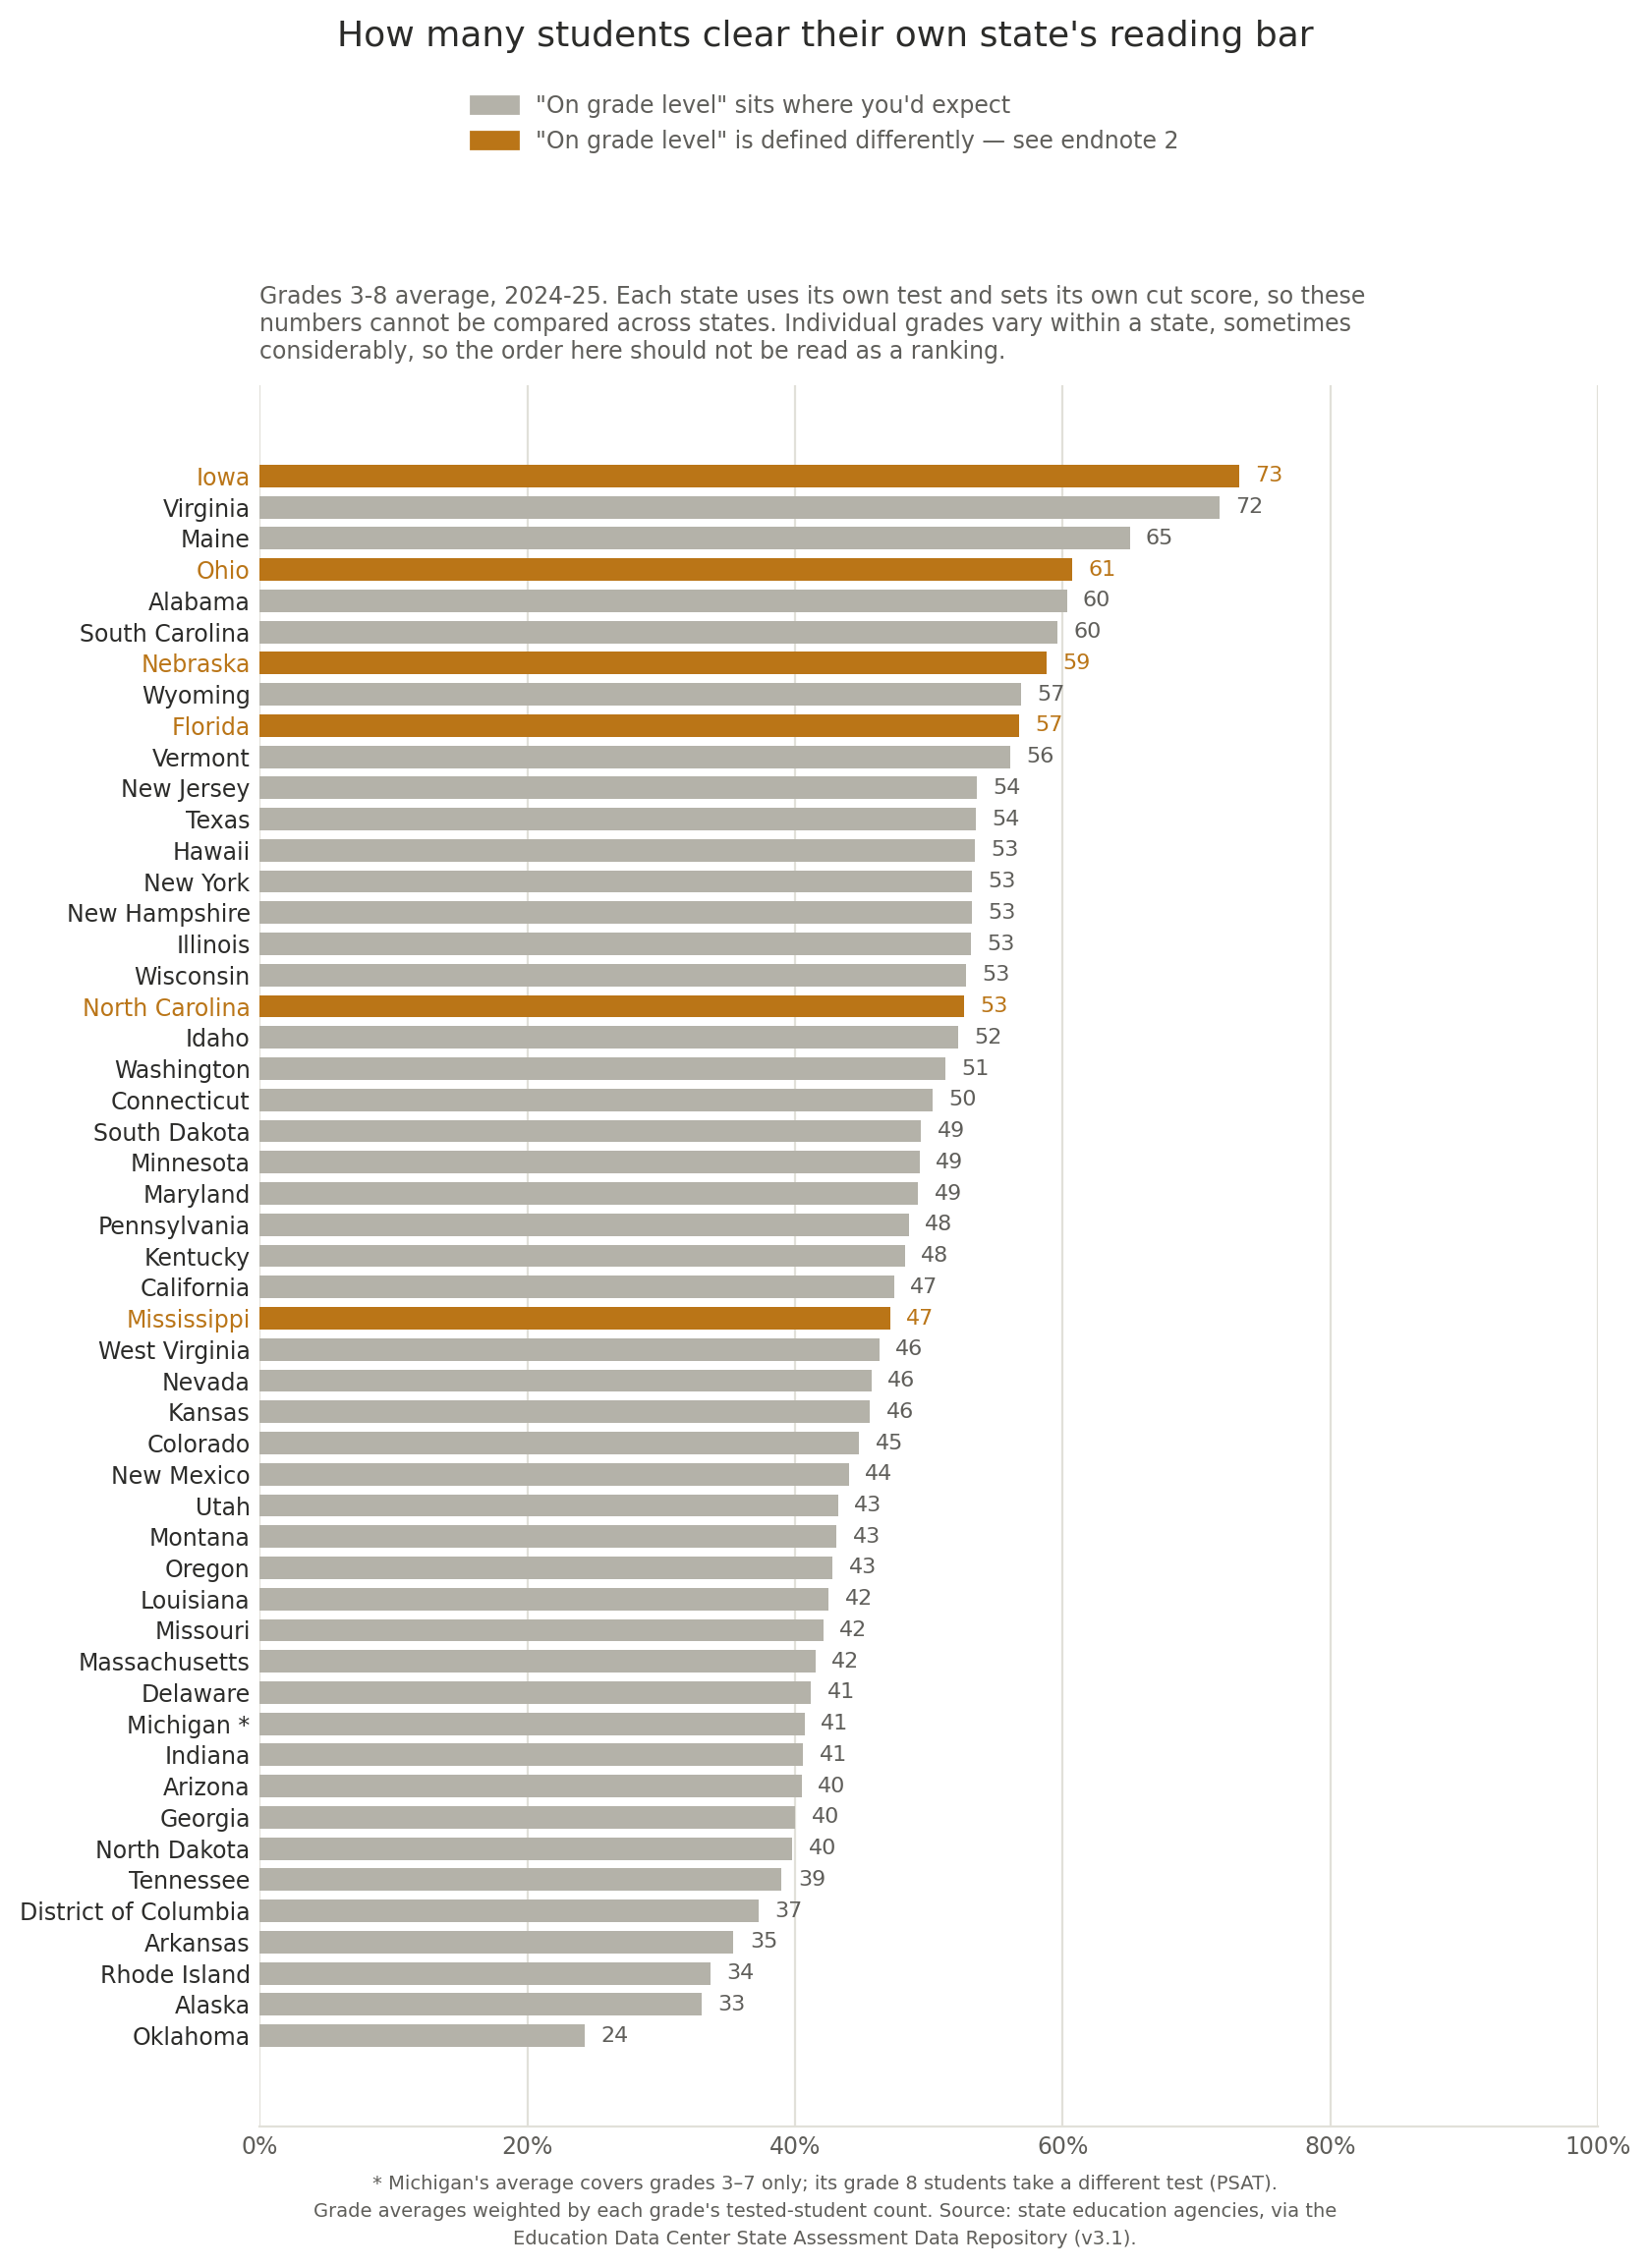 You shouldn’t compare students’ reading proficiency rates across states. Students took different tests, with different cut scores, and different definitions of passing. Iowa’s 73% proficiency rate only tells us about how students in Iowa performed on the Iowa test, and it does not tell us that Iowa has more proficient readers than any other state. We could only get that answer if students across states took the same test with the same scoring system.
What this chart can tell us is this: across the 50 states and D.C., 46 have more than 40% of students failing to meet their state's own bar.⁸
So how do we know if reading is getting better?
That's what the National Assessment of Educational Progress (NAEP) is for. NAEP has been around since 1969, but states could choose whether to take part. No Child Left Behind changed that. Now, any state accepting federal Title I money has to let a sample of its fourth and eighth graders take the NAEP reading test, which usually happens every two years.⁹NAEP gets criticized for setting a higher bar for proficiency than many states set for grade level. That criticism is fair, and NCES says so itself: NAEP Proficient does not represent grade-level proficiency.¹⁰ But because students across states take the same test, we can compare reading proficiency rates across states over time.
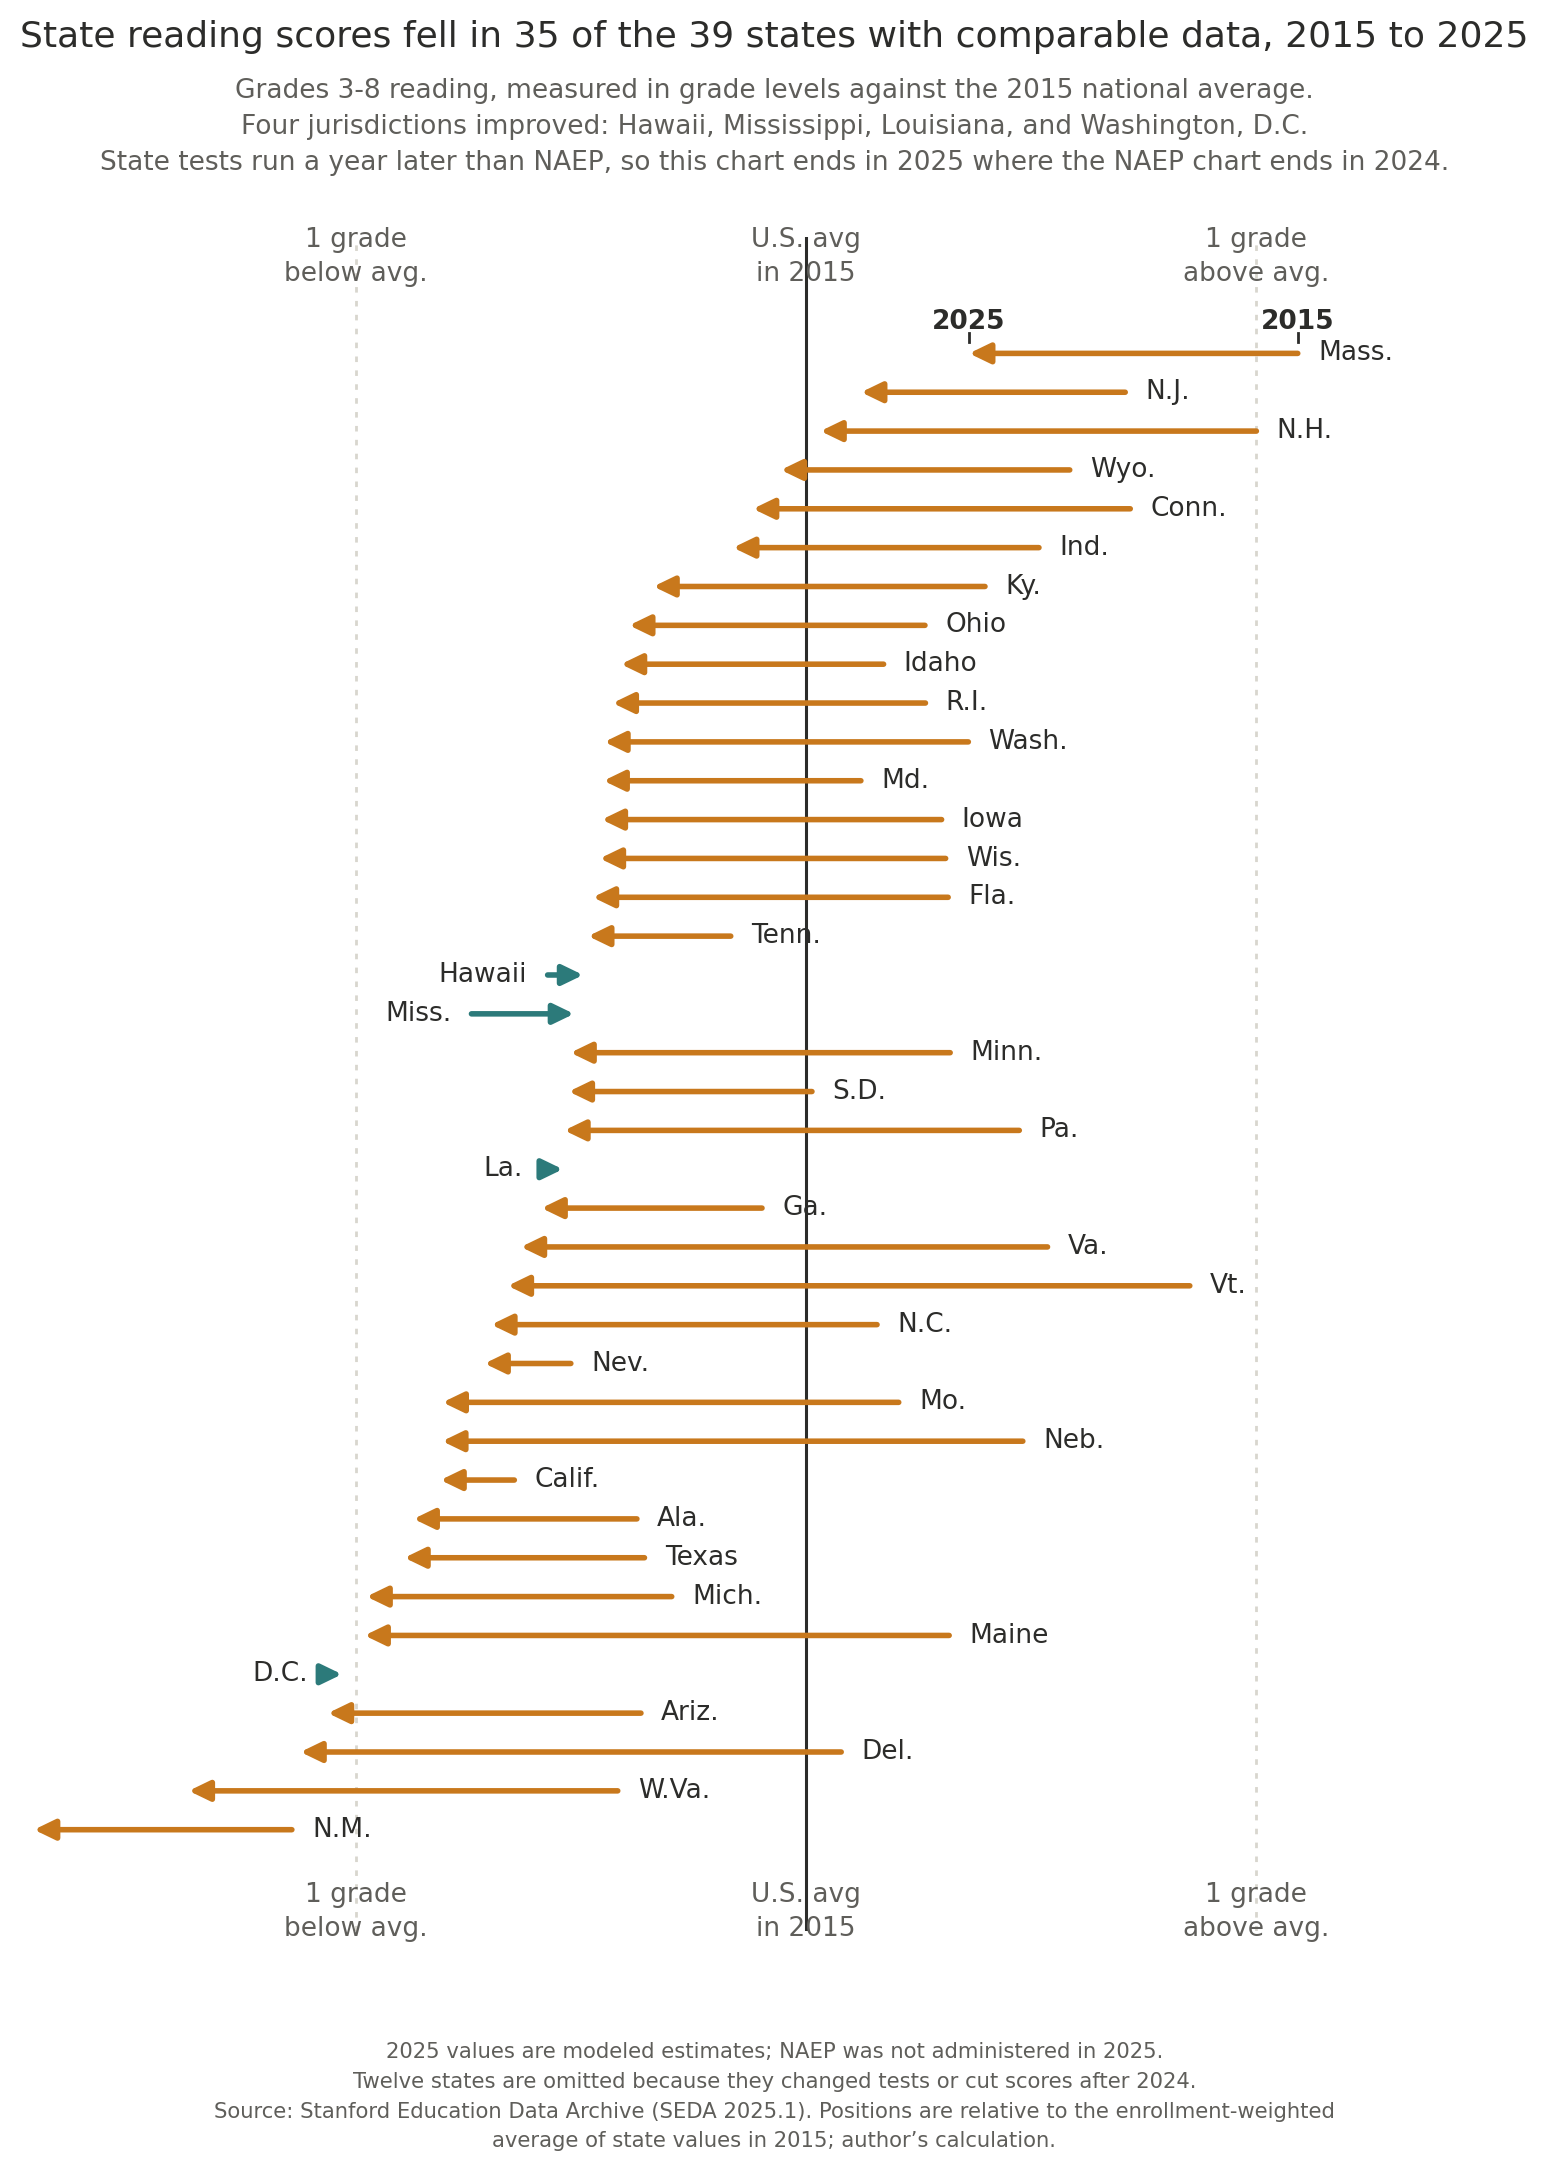
Researchers at Stanford have worked out how each state's test maps onto the NAEP scale. That lets us line the states up against each other and see if reading has gotten better over time.
Of the 38 states and D.C. with comparable data, reading scores fell in all but four over the last decade.¹¹
The actual NAEP scores show the same decline. In both fourth and eighth grade, the share of students reading below Basic rose nine percentage points since 2015. At the same time, the share of students who were at or above Proficient fell.¹²
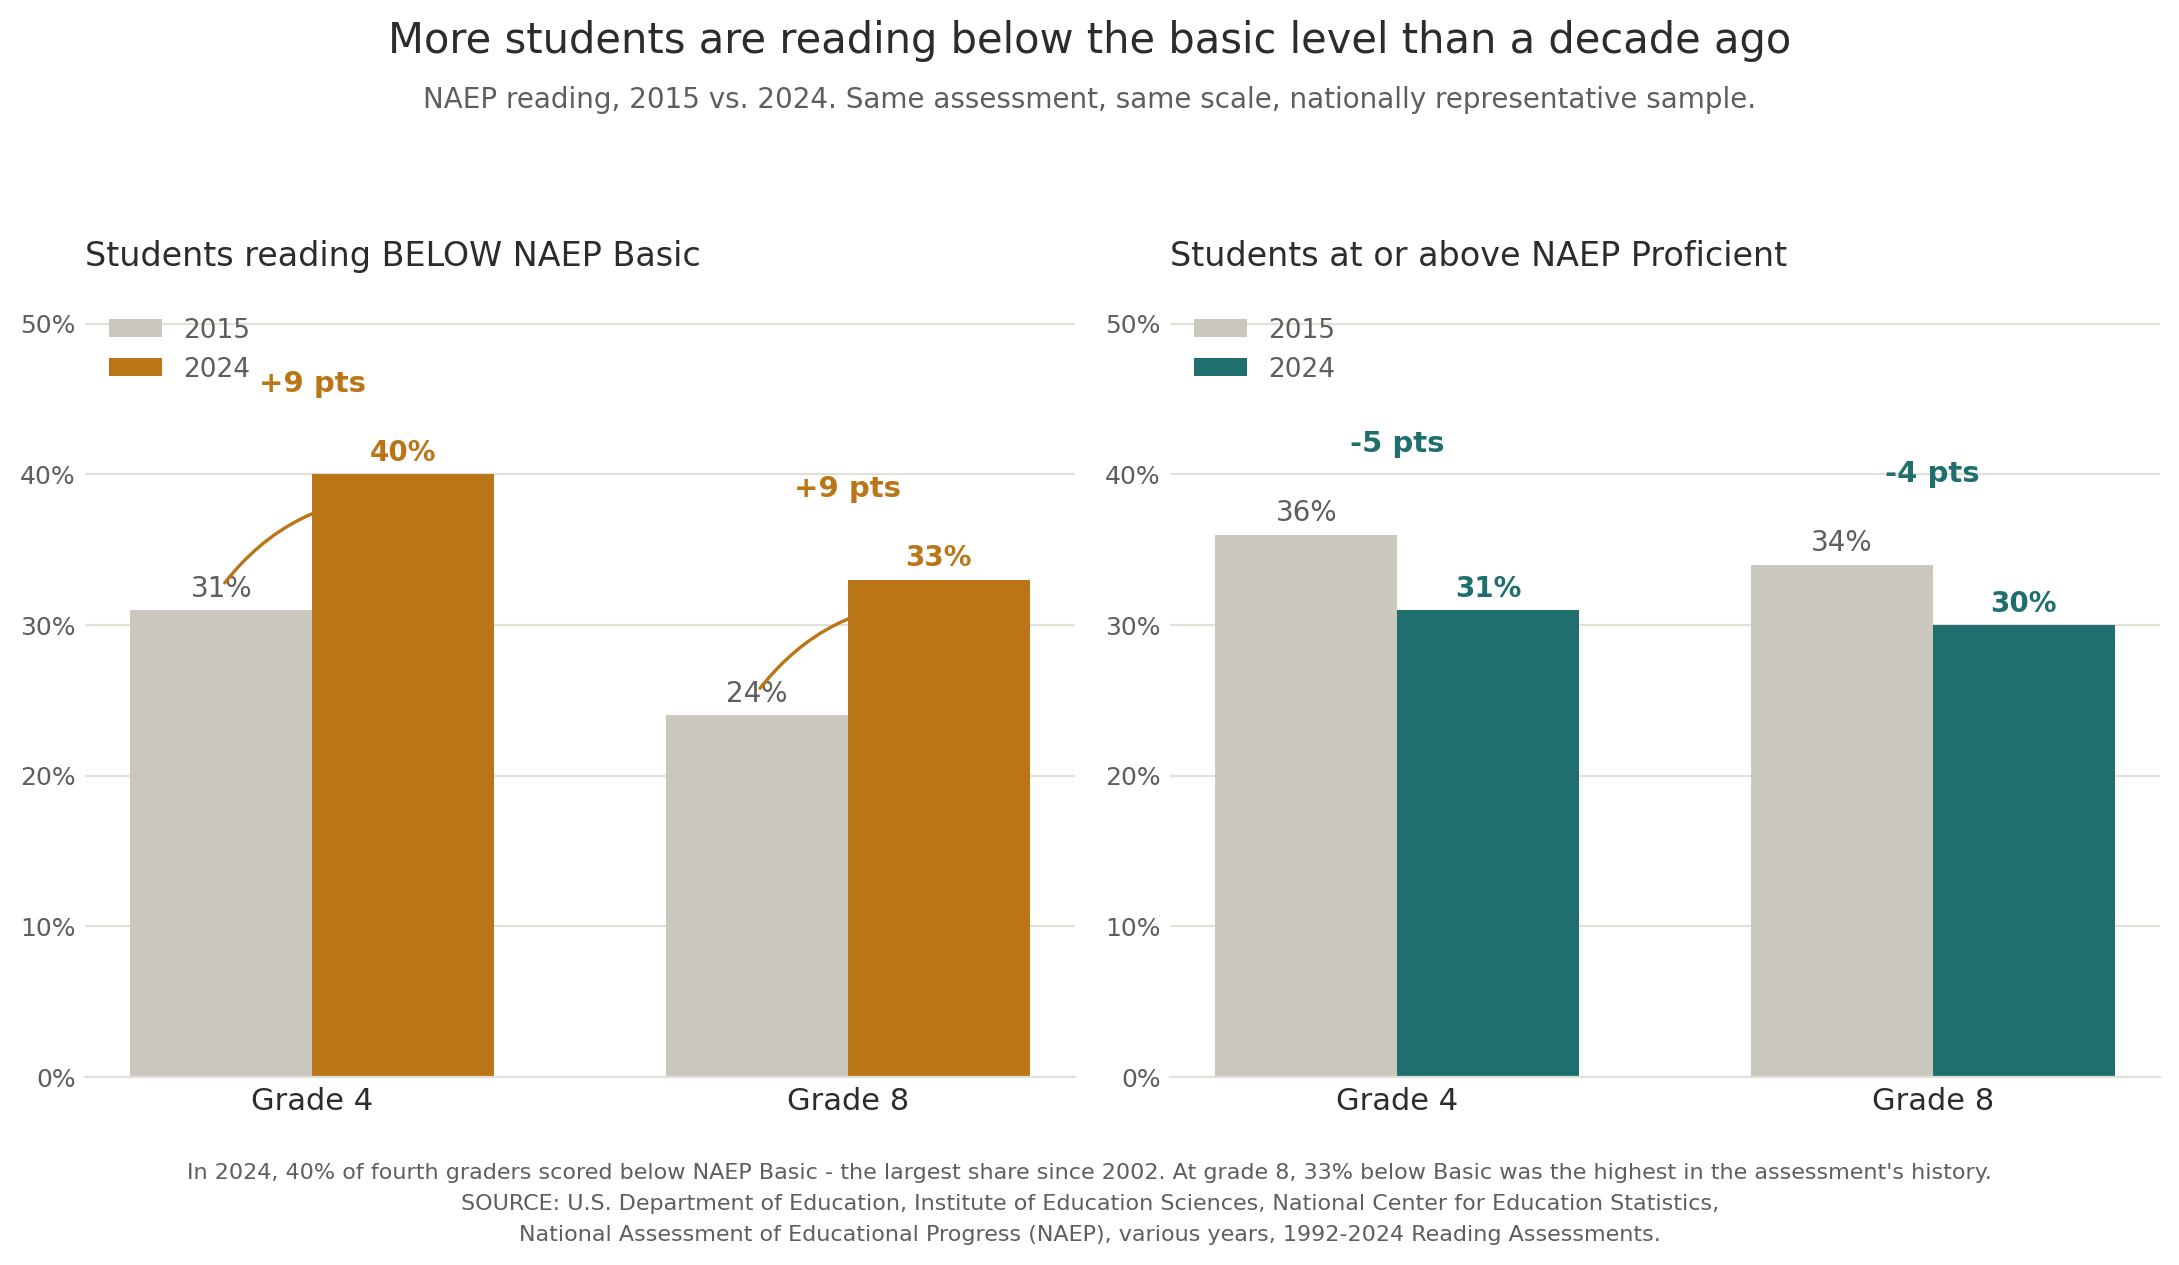 NAEP and the states agree that at least two in five American students are not reading well, despite measuring it differently.⁸,¹²
What have states tried to improve reading proficiency?
Since 2019, states have passed more than 600 reading laws and spent hundreds of millions of dollars to get more students reading on grade level.¹³ But this movement didn't start with politicians. It started with parents.For years, parents of struggling readers had been fighting to change how schools teach reading. They fought state by state without making much headway. Then the pandemic hit, and parents got a front-row seat to daily reading lessons. In October 2022, a podcast called Sold a Story explained what they’d been watching: an approach called three-cueing, contradicted by decades of cognitive science, and still being sold to schools.¹⁴
The podcast went viral. It supercharged the push for reform, and 26 states passed new reading laws over the next three years.¹⁵ Check out Sold a Story wherever you listen to podcasts. It explains how a generation of kids was taught to read, and what it cost them.
Next week: the two things most states did to fix reading, the one they skipped, and what it cost. Subscribe to get it in your inbox.
Also, the Education Data Center is tracking state-by-state 2025-26 assessment results as they are released. You can view their interactive map to get an idea of how students in each state performed on the state’s end-of-year assessment.
Endnotes
- The No Child Left Behind Act of 2001 (P.L. 107-110), signed January 2002, required annual reading and mathematics testing in grades 3-8 and once in high school, to be fully implemented by the 2005-06 school year. The Every Student Succeeds Act (P.L. 114-95), signed December 10, 2015, retained annual testing while eliminating the Adequate Yearly Progress framework and returning accountability design to the states. Statewide testing did not happen in spring 2020. The U.S. Department of Education invited waiver requests under section 8401(b) of the ESEA and approved waivers for 53 state education agencies — all 50 states, the District of Columbia, Puerto Rico, and the Bureau of Indian Education — covering the assessment requirements in ESEA section 1111(b)(2) along with related accountability and reporting requirements. Testing resumed in spring 2021: the Department declined to grant blanket testing waivers that year while offering accountability flexibilities, and a small number of jurisdictions, including the District of Columbia, received individual assessment waivers. Participation and comparability were uneven as a result.
- Achievement level structures compiled from state education agency documentation and from the Education Data Center's State Assessment Data Repository (v3.1). Forty-one states use a four-level scale in which Levels 3 and 4 count as proficient. Ten jurisdictions depart from that pattern: Five levels, Levels 4 and 5 counted as proficient: Colorado, the District of Columbia, Louisiana, Mississippi, and New Jersey. Mississippi's levels are Minimal, Basic, Passing, Proficient, and Advanced; its published proficiency rate counts Levels 4 and 5 only, leaving its own Passing tier out of the number. Five levels, Levels 3 through 5 counted as proficient: Florida (Level 3 "On Grade Level," Level 4 Proficient, Level 5 Exemplary) and Ohio (Limited, Basic, Proficient, Accomplished, Advanced). For Ohio, see Ohio Department of Education and Workforce, Office of Assessment, Statistical Summary: Spring 2025 Administration of Ohio's State Tests. Table 3 lists the five levels alongside a combined "At or Above Proficient" figure that sums the top three. Three levels, middle level as the grade-level mark: Iowa (Not Yet Proficient, Proficient, Advanced) and Nebraska (Developing, On Track, Advanced). Iowa's new standards-aligned assessment, first administered in spring 2026, uses four levels. Four levels with a lower bar: North Carolina, which counts three of its four levels as on grade level rather than two. Level names vary widely among the forty-one conventionally structured states — California uses Standard Not Met, Standard Nearly Met, Standard Met, and Standard Exceeded; Georgia uses Beginning, Developing, Proficient, and Distinguished Learner; Tennessee uses Below, Approaching, On Track, and Mastered; Texas uses Did Not Meet, Approaches, Meets, and Masters Grade Level; Virginia uses Fail/Below Basic, Fail/Basic, Pass/Proficient, and Pass/Advanced.
- Texas Education Agency, STAAR Performance Standards. TEA’s policy definition of the Meets Grade Level standard states that students in this category “have a high likelihood of success in the next grade or course but may still need some short-term, targeted academic intervention.”
- Florida Department of Education, Understanding Florida Statewide Assessments Reports for Families, April 2026 edition, p. 6. The achievement level figure lists Level 3 as "On Grade Level: May need additional support for the next grade/course," Level 4 as Proficient, and Level 5 as Exemplary. FDOE states that achievement levels range from 1 to 5 as required by state law and that Level 3 indicates on grade level performance across all assessments.
- Mississippi Department of Education, MAAP results executive summary. MAAP's five levels are Minimal, Basic, Passing, Proficient, and Advanced; MDE's published proficiency rate counts Levels 4-5 only.
- North Carolina Department of Public Instruction, Individual Student Reports. DPI states that four achievement levels are reported for EOG and EOC tests — Not Proficient, Level 3, Level 4, and Level 5 — and that Levels 3 and above indicate on-grade-level performance.
- Iowa Department of Education (ISASP levels: Not Yet Proficient, Proficient, Advanced; new standards-aligned assessment first administered spring 2026 with four levels). Nebraska Department of Education (NSCAS levels: Developing, On Track, Advanced).
- Author's analysis of state assessment results for 2024-25, compiled from state education agencies via the Education Data Center's State Assessment Data Repository (v3.1) and spot-checked against primary state reports for Florida, Maryland, Tennessee, Texas, Virginia, and North Carolina. Each state's figure averages grades 3–8, weighted by the number of students tested in each grade, so the average reflects the state's actual distribution of students rather than treating every grade equally. Of the 50 states and the District of Columbia, 46 averaged below 60%. Counts use unrounded figures, so two jurisdictions displayed as 60% on the chart fall on opposite sides of the line: Alabama at 60.3% is above it, and South Carolina at 59.6% is below.
- NCES, Important Aspects of No Child Left Behind Relevant to NAEP. Under No Child Left Behind (P.L. 107-110), any state seeking a Title I grant had to assure that, beginning in the 2002-03 school year, it would participate in the biennial state-level NAEP in reading and mathematics at grades 4 and 8. ESSA retained this requirement. Per the National Assessment Governing Board, Congress requires all states to participate in the grade 4 and 8 NAEP reading and mathematics assessments every two years as a condition of receiving federal aid — under NCLB and then under ESSA. State and district Title I applications must include an assurance of participation, and the requirement reaches Title I local education agencies and their schools, not states alone. NCES notes on the same page that the federal government pays for administration of all state NAEP assessments, that no rewards or sanctions attach to state NAEP results, and that NAEP participation is not a substitute for a state’s own assessment of all students in grades 3-8. NAEP itself dates to 1969 and state participation was voluntary before 2003; those facts are drawn from NCES program history rather than this page. The 2021 administration was postponed because of the pandemic, and in March 2021 the National Assessment Governing Board moved the grades 4 and 8 reading and mathematics assessments permanently to even-numbered years. Reading results therefore run 2019, 2022, and 2024.
- NCES, NAEP Scores and Achievement Levels. NCES states that students at or above NAEP Proficient demonstrate solid academic performance and competency over challenging subject matter, and adds that the NAEP Proficient achievement level does not represent grade-level proficiency as determined by other assessment standards, such as state or district assessments. The National Assessment Governing Board's 2018 revised Policy Statement makes the same point, clarifying that NAEP Proficient is not intended to reflect grade-level performance expectations and is specific to performance on NAEP assessments. NAEP's achievement levels also remain provisional: a 2016 National Academies committee concluded that more evidence was needed to establish whether they are reasonable, valid, and informative, and the NCES Commissioner has maintained their trial status. The below-Basic figures cited elsewhere in this post are a separate measure and are not affected by this caveat.
- Stanford Education Data Archive: Reardon, S. F., Fahle, E. M., Ho, A. D., Shear, B. R., Saliba, J., Min, J., Shim, J., & Kalogrides, D. (2026), Stanford Education Data Archive (Version SEDA 2025.1), https://doi.org/10.25740/hm970gr1371. Technical documentation: Fahle, E. M., Saliba, J., Min, J., Reardon, S. F., Shear, B. R., Shim, J., Kalogrides, D., & Ho, A. D. (2026), Stanford Education Data Archive Technical Documentation: SEDA 2025.1. See also the Educational Opportunity Project at Stanford University. A word on what this chart is measuring, because it is not the same thing as the state-by-state chart above. State tests cannot be compared to each other directly. SEDA gets around that by estimating what each state's results would look like on the NAEP scale, using the historical relationship between a state's own test scores and its NAEP scores in years when the state did not change its test. The positions on this chart are therefore estimates on a common scale, not raw state proficiency rates, which is what makes it possible to compare states to each other, and to 2015, on the same terms. SEDA reports these estimates in grade-level units; its documentation recommends this scale specifically for reporting to non-research audiences. The 2015 reference line is the enrollment-weighted average of state values in that year, calculated by the author; SEDA does not publish a national figure in this file. Three limits worth knowing. First, the data come from three sources and change partway through the series: SEDA draws 2009–2019 state proficiency data from the U.S. Department of Education's EDFacts system, 2022–2025 data from the Education Data Center's State Assessment Data Repository, and uses NAEP throughout as the common scale. There is no 2020 or 2021 data, since most states did not test during those years. Second, NAEP was not administered in 2025, so the 2025 endpoint is a modeled estimate rather than an observed score: SEDA projects what each state's NAEP result would have been, based on the historical relationship between state test trends and NAEP trends, applied to the state's own 2024-to-2025 change. Third, twelve states are omitted because comparable 2025 data were unavailable. SEDA excludes a state's data for 2025 if the state changed its assessment or its cut scores from the prior year. Those states are Alaska, Arkansas, Colorado, Illinois, Kansas, Montana, New York, North Dakota, Oklahoma, Oregon, South Carolina, and Utah. The thirty-nine remaining jurisdictions include the District of Columbia. Of those thirty-nine, thirty-five declined and four improved: Hawaii, Louisiana, Mississippi, and Washington, D.C.
- NCES, Condition of Education (2015 figures, verified against Digest of Education Statistics table 221.12) and the 2024 NAEP Reading Report Card (NCES 2024218, January 2025). The Digest table shows that in 2015, 31% of fourth graders and 24% of eighth graders scored below NAEP Basic, while 36% and 34% respectively scored at or above NAEP Proficient. In 2024 those figures were 40% and 33% below Basic, and 31% and 30% at or above Proficient. Digest figures include public, private, Bureau of Indian Education, and Department of Defense Education Activity schools; NCES’s public-school-only figures for 2024 run one point higher below Basic at both grades. The 2024 achievement-level percentages have not been traced to an equivalent Digest table. NAEP assesses grades 4 and 8; state assessments cover grades 3–8. Neither produces estimates for other grades.
- Albert Shanker Institute literacy legislation database, tracking more than 600 laws enacted since 2019. The database supports the count of laws only — the Shanker report states that its analysis does not track funding provisions accompanying this legislation. The funding claim rests on NCTQ’s State of the States 2024, which found that 36 states invested more than $660 million in literacy training for practicing teachers within an eighteen-month window. That figure covers teacher professional learning alone and excludes state spending on curriculum materials, literacy coaches, and screening — so “hundreds of millions” is a conservative floor rather than a total.
- Sold a Story, APM Reports, first two episodes released October 20, 2022.
- APM Reports, New reading laws sweep the nation following Sold a Story. APM reports that 26 states enacted laws to better align reading instruction with scientific research in the three years following the podcast. Their own note on the accompanying map is worth carrying: it shows only states that passed laws since late 2022, and some additional states had reading laws or policies on the books before the podcast aired. The wave began in 2013; APM describes the post-podcast period as an acceleration of an existing trend rather than its origin. Emily Hanford has separately estimated that roughly 15 of these laws came directly in response to her reporting.